
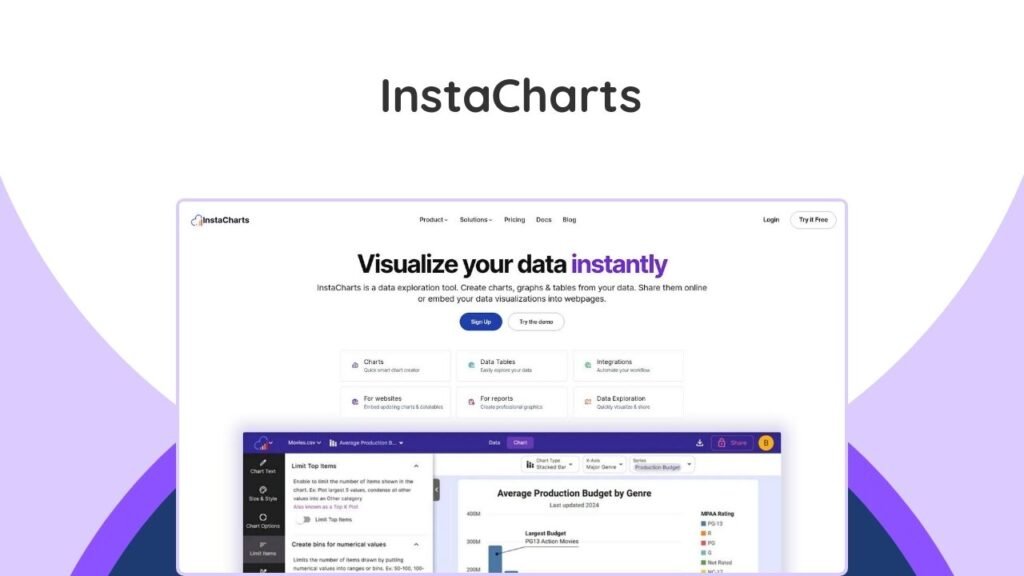
InstaCharts is a powerful tool that allows users to instantly create, share, and embed interactive charts and data tables directly from spreadsheet files, JSON data, Google Sheets, and more. This platform is designed to help individuals and businesses quickly unlock useful insights from their data without needing extensive coding knowledge. It automates the chart creation process by analyzing data structure and suggesting the most effective visualizations. Whether you are a blogger, marketer, or data analyst, InstaCharts provides a seamless way to transform raw data into engaging visual stories. This article will delve into how InstaCharts works, its key features, and why it stands out as an essential tool for data visualization.
What is InstaCharts?
InstaCharts is a web-based application focused on simplifying the process of data visualization. It serves as a bridge between complex datasets and easily understandable visual representations, such as charts and tables. The platform supports various file types, including .csv, Excel, .tsv, .json, and .log, making it versatile for different data sources. By offering smart visual suggestions and real-time exploration capabilities, InstaCharts empowers users to make data-driven decisions more efficiently.
How Does InstaCharts Simplify Data Visualization?
InstaCharts simplifies data visualization by automating the conversion of raw data into interactive charts and tables. Users simply upload their data, and the platform’s algorithm analyzes the structure to recommend suitable chart types. This eliminates the need for manual chart creation and complex configurations, allowing users to quickly gain insights from their information. The ease of use extends to sharing and embedding, making data accessible across various platforms like WordPress, Substack, and Ghost.
What Data Sources Does InstaCharts Support?
InstaCharts supports a wide array of data sources to ensure flexibility for its users. The primary supported file types for direct upload include:
- Spreadsheet files: .csv, Excel (.xls, .xlsx)
- Text-based files: .tsv, .log
- Structured data: .json
Beyond static file uploads, InstaCharts also offers seamless integration with cloud-based services:
- Google Sheets: Data can be pulled directly from Google Sheets and kept in sync.
- Google Drive: Various file types from Google Drive can be integrated and synchronized.
This broad compatibility ensures that users can work with their data regardless of its original format or storage location, making it a highly adaptable tool for diverse data visualization needs.
Key Features of InstaCharts
InstaCharts is packed with features designed to make data exploration and presentation as efficient and impactful as possible. From smart suggestions to real-time interactions, its capabilities cater to both novice and experienced users.
What are the Core Features for Data Exploration?
The core features for data exploration in InstaCharts are designed to help users quickly understand and manipulate their data:
- Quick Data Exploration: Users can upload various spreadsheet and JSON file types (.csv, Excel, .tsv, .json, .log) and instantly generate charts.
- Smart Visual Suggestions: The platform’s algorithm analyzes data structure and recommends the most effective chart types, highlighting important trends automatically. This helps users choose the best visual representation without guesswork, saving time and improving data interpretation.
- Real-Time Exploration: Visualizations update instantly as users filter, sort, and manipulate their data. This dynamic interaction allows for rapid hypothesis testing and exploration of different data angles in seconds. According to LinkedIn research, interactive visualizations significantly improve understanding and retention by allowing active data exploration.
- Diverse Chart Types: InstaCharts currently offers 10 different chart types, including line, bar, area, pie, scatterplot, and a data table, providing flexibility for various data presentation needs.
How Does InstaCharts Facilitate Embedding and Sharing?
InstaCharts makes embedding and sharing interactive charts and tables straightforward and hassle-free, enhancing user engagement across different platforms:
- Simple Copy & Paste Embed Code: Users can easily generate an embed code for their charts and tables, which can then be copied and pasted directly into various websites and platforms.
- Broad Platform Compatibility: The embedded charts work seamlessly with popular content management systems and publishing platforms like WordPress, Substack, and Ghost. This ensures that charts maintain their interactivity and professional appearance no matter where they are published.
- Interactive Charts for Engagement: Embedded charts are interactive, allowing readers to explore the data themselves. This fosters a better user experience and encourages deeper engagement with the content. For example, readers can filter or zoom in on data points, making the information more accessible and impactful. The ability to interact with data helps users uncover hidden relationships, as noted by GoodData.
- Shareable Data Tables: Beyond graphical charts, users can also share data insights through embedded interactive data tables, providing detailed views of the underlying information.
What are the Data Synchronization and Template Features?
InstaCharts offers advanced features for data synchronization and template creation, which are crucial for maintaining up-to-date visualizations and streamlining the chart-making process:
- Google Sheets Integration: Connect directly to Google Sheets to pull data, with the option to keep it continuously in sync with the original source.
- Google Drive Integration: Supports pulling data from various file types stored on Google Drive, also with synchronization capabilities. This allows for broad compatibility with existing data storage solutions.
- Sync Schedules: Users can set up automated sync schedules (hourly, daily, or monthly) to ensure their charts always display the freshest data without manual updates.
- Chart Templates: Create interactive, no-code charts on the fly using pre-designed chart templates. These templates are significant time-savers and can be embedded or shared as standalone pages, perfect for recurring reports or standardized data presentations.
- Image Templates: Generate static chart images instantly using image templates. This powerful feature allows for quick creation and sharing of professional-looking static charts for reports or social media.
InstaCharts Lifetime Deal and Pricing
InstaCharts offers a compelling lifetime deal, providing long-term value for users looking to invest in a robust data visualization tool. This section outlines the pricing structure and key terms of the deal.
What is the InstaCharts Lifetime Deal?
The InstaCharts Lifetime Deal is a limited-time offer that provides users with permanent access to the software’s features for a one-time payment. This eliminates recurring subscription costs, making it a cost-effective solution for long-term data visualization needs. The deal typically comes with specific plan tiers, each offering different levels of features and usage limits.
What are the InstaCharts Lifetime Deal Pricing Plans?
The InstaCharts Lifetime Deal is available in multiple tiers, each with a one-time payment. While specific pricing can vary, the structure is designed to offer flexibility based on usage requirements:
| Plan | Payment | Key Features |
|---|---|---|
| Plan 1 | One-time payment | Access to core chart creation, embedding, and basic sync features. Ideal for individuals or small projects with moderate data visualization needs. |
| Plan 2 | One-time payment | Includes all features of Plan 1, plus enhanced capabilities like more frequent sync schedules, additional chart types, or higher data row limits. Suitable for professionals or growing businesses. |
All plans typically come with a 60-day money-back guarantee, allowing users to try the software for two months to ensure it meets their needs without risk.
Who Can Benefit from InstaCharts?
InstaCharts is a versatile tool that can benefit a wide range of individuals and businesses across various sectors. Its ease of use and powerful features make it suitable for anyone needing to visualize data effectively.
Is InstaCharts Suitable for Marketers and Bloggers?
Yes, InstaCharts is highly suitable for marketers and bloggers. In content creation, engaging visuals are crucial for captivating audiences and conveying information clearly. InstaCharts allows marketers to:
- Visualize Campaign Data: Easily create charts to show campaign performance, website traffic, or social media engagement.
- Enhance Blog Posts: Embed interactive charts directly into blog articles (compatible with WordPress, Substack, Ghost) to make data-driven content more dynamic and digestible.
- Create Engaging Reports: Generate professional-looking charts for client reports or internal presentations, transforming complex data into easily understandable insights. For instance, a blogger could quickly generate charts to illustrate visitor demographics, conversion rates, or content popularity, much like how SiteGuru helps with website analytics.
Can Businesses and Data Analysts Utilize InstaCharts Effectively?
Absolutely, businesses and data analysts can utilize InstaCharts very effectively. Data is at the core of business decision-making, and InstaCharts streamlines the process of extracting and presenting valuable insights:
- Quickly Explore Business Data: Upload sales figures, financial reports, or operational data to instantly generate visual summaries, aiding in faster decision-making.
- Monitor Trends: Use real-time exploration to identify trends, patterns, and anomalies in business performance, helping to react proactively to market changes.
- Improve Collaboration: Share interactive charts and tables with team members or stakeholders, fostering a shared understanding of key metrics and facilitating data-driven discussions.
- Automate Reporting: Leverage Google Sheets/Drive integration and sync schedules to automate regular reporting, ensuring that key performance indicators (KPIs) are always up-to-date. This can complement other automation tools like Easy Text Marketing Platform for streamlined workflows.
Customers appreciate InstaCharts for its intuitive interface and seamless data syncing, enabling them to create professional-looking charts in minutes. While some users have noted the 100,000-row limitation as a point for improvement, its overall rating of 4.9 and a 60-day money-back guarantee underscore its reliability and user satisfaction.
Conclusion
The InstaCharts Lifetime Deal presents a valuable opportunity for anyone looking to simplify and enhance their data visualization efforts. By offering intuitive chart creation, seamless integration with popular data sources like Google Sheets, and versatile embedding options, InstaCharts empowers users to transform raw data into engaging, interactive visuals. Its focus on ease of use, coupled with powerful features like smart visual suggestions and real-time exploration, makes it an indispensable tool for marketers, bloggers, businesses, and data analysts alike.
Investing in InstaCharts means gaining a reliable solution for making data more accessible and actionable, ultimately leading to better decision-making and more compelling content. Its positive user reviews and money-back guarantee further solidify its position as a trustworthy and effective platform in the data visualization landscape. For those seeking to unlock the full potential of their data without the complexities of traditional charting tools, the InstaCharts Lifetime Deal is a practical and beneficial investment. Consider how similar lifetime deals, such as the Writecream Lifetime Deal, offer lasting value for digital content creation needs.
Frequently Asked Questions (FAQs)
What types of files can InstaCharts import?
InstaCharts can import various file types, including .csv, Excel (.xls, .xlsx), .tsv, .json, and .log files. It also integrates directly with Google Sheets and Google Drive for live data synchronization.
Are the charts created with InstaCharts interactive?
Yes, charts created and embedded using InstaCharts are interactive. This allows viewers to engage directly with the data by filtering, sorting, or exploring different data points for a more dynamic user experience.
Can I embed InstaCharts charts on my WordPress website?
Yes, InstaCharts charts are designed for easy embedding and are fully compatible with WordPress, Substack, Ghost, and other popular content management systems. You simply copy and paste the provided embed code.
Is there a limit to the number of rows of data I can use?
Some users have noted a 100,000-row limitation as an area for improvement. For specific plan limitations, it is best to consult the deal terms and conditions or the InstaCharts support.
Does InstaCharts offer a money-back guarantee?
Yes, InstaCharts typically offers a 60-day money-back guarantee, allowing users to try the software for two months to ensure it meets their needs.